One of the biggest problems with the current debate about Container vs Hypervisor security is that no-one has actually developed a way of measuring security, so the debate is all in qualitative terms (hypervisors “feel” more secure than containers because of the interface breadth) but no-one actually has done a quantitative comparison. The purpose of this blog post is to move the debate forwards by suggesting a quantitative methodology for measuring the Horizontal Attack Profile (HAP). For more details about Attack Profiles, see this blog post. I don’t expect this will be the final word in the debate, but by describing how we did it I hope others can develop quantitative measurements as well.
Well begin by looking at the Nabla technology through the relatively uncontroversial metric of performance. In most security debates, it’s acceptable that some performance is lost by securing the application. As a rule of thumb, placing an application in a hypervisor loses anywhere between 10-30% of the native performance. Our goal here is to show that, for a variety of web tasks, the Nabla containers mechanism has an acceptable performance penalty.
Performance Measurements
We took some standard benchmarks: redis-bench-set, redis-bench-get, python-tornado and node-express and in the latter two we loaded up the web servers with simple external transactional clients. We then performed the same test for docker, gVisor, Kata Containers (as our benchmark for hypervisor containment) and nabla. In all the figures, higher is better (meaning more throughput):


The red Docker measure is included to show the benchmark. As expected, the Kata Containers measure is around 10-30% down on the docker one in each case because of the hypervisor penalty. However, in each case the Nabla performance is the same or higher than the Kata one, showing we pay less performance overhead for our security. A final note is that since the benchmarks are network ones, there’s somewhat of a penalty paid by userspace networking stacks (which nabla necessarily has) for plugging into docker network, so we show two values, one for the bridging plug in (nabla-containers) required to orchestrate nabla with kubernetes and one as a direct connection (nabla-raw) showing where the performance would be without the network penalty.
One final note is that, as expected, gVisor sucks because ptrace is a really inefficient way of connecting the syscalls to the sandbox. However, it is more surprising that gVisor-kvm (where the sandbox connects to the system calls of the container using hypercalls instead) is also pretty lacking in performance. I speculate this is likely because hypercalls exact their own penalty and hypervisors usually try to minimise them, which using them to replace system calls really doesn’t do.
HAP Measurement Methodology
The Quantitative approach to measuring the Horizontal Attack Profile (HAP) says that we take the bug density of the Linux Kernel code and multiply it by the amount of unique code traversed by the running system after it has reached a steady state (meaning that it doesn’t appear to be traversing any new kernel paths). For the sake of this method, we assume the bug density to be uniform and thus the HAP is approximated by the amount of code traversed in the steady state. Measuring this for a running system is another matter entirely, but, fortunately, the kernel has a mechanism called ftrace which can be used to provide a trace of all of the functions called by a given userspace process and thus gives a reasonable approximation of the number of lines of code traversed (note this is an approximation because we measure the total number of lines in the function taking no account of internal code flow, primarily because ftrace doesn’t give that much detail). Additionally, this methodology works very well for containers where all of the control flow emanates from a well known group of processes via the system call information, but it works less well for hypervisors where, in addition to the direct hypercall interface, you also have to add traces from the back end daemons (like the kvm vhost kernel threads or dom0 in the case of Xen).
HAP Results
The results are for the same set of tests as the performance ones except that this time we measure the amount of code traversed in the host kernel:

As stated in our methodology, the height of the bar should be directly proportional to the HAP where lower is obviously better. On these results we can say that in all cases the Nabla runtime tender actually has a better HAP than the hypervisor contained Kata technology, meaning that we’ve achieved a container system with better HAP (i.e. more secure) than hypervisors.
Some of the other results in this set also bear discussing. For instance the Docker result certainly isn’t 10x the Kata result as a naive analysis would suggest. In fact, the containment provided by docker looks to be only marginally worse than that provided by the hypervisor. Given all the hoopla about hypervisors being much more secure than containers this result looks surprising but you have to consider what’s going on: what we’re measuring in the docker case is the system call penetration of normal execution of the systems. Clearly anything malicious could explode this result by exercising all sorts of system calls that the application doesn’t normally use. However, this does show clearly that a docker container with a well crafted seccomp profile (which blocks unexpected system calls) provides roughly equivalent security to a hypervisor.
The other surprising result is that, in spite of their claims to reduce the exposure to Linux System Calls, gVisor actually is either equivalent to the docker use case or, for the python tornado test, significantly worse than the docker case. This too is explicable in terms of what’s going on under the covers: gVisor tries to improve containment by rewriting the Linux system call interface in Go. However, no-one has paid any attention to the amount of system calls the Go runtime is actually using, which is what these results are really showing. Thus, while current gVisor doesn’t currently achieve any containment improvement on this methodology, it’s not impossible to write a future version of the Go runtime that is much less profligate in the way it uses system calls by developing a Secure Go using the same methodology we used to develop Nabla.
Conclusions
On both tests, Nabla is far and away the best containment technology for secure workloads given that it sacrifices the least performance over docker to achieve the containment and, on the published results, is 2x more secure even than using hypervisor based containment.
Hopefully these results show that it is perfectly possible to have containers that are more secure than hypervisors and lays to rest, finally, the arguments about which is the more secure technology. The next step, of course, is establishing the full extent of exposure to a malicious application and to do that, some type of fuzz testing needs to be employed. Unfortunately, right at the moment, gVisor is simply crashing when subjected to fuzz testing, so it needs to become more robust before realistic measurements can be taken.
These HAP measurements are very interesting but on their own I don’t think they justify the conclusions you draw. As you mention later in the post, what you actually want to measure is the amount of kernel code that a compromised container could exercise (weighted by bug density). You seem to assume that is proportional (or ideally equal to) to the amount of kernel code actual exercised by the container post-startup, i.e. that there is a “well crafted seccomp profile” in place to ensure this, but it is not always possible for seccomp to restrict kernel exposure to just what one particular container workload does.
For example seccomp can’t check the pathname passed to open(), so the container’s filesystem view needs to be carefully locked down or an attacker could potentially exercise all kinds of crazy of kernel code. But a wide-open container filesystem view would not change the results you have shown here, thus these results could lead to the wrong conclusions.
OK,so I think the question is whether seccomp can restrict the HAP exposure of a given docker image. I also think you might not be aware of seccomp-filter which definitely can do things like checking the pathname to open().
When you supply a seccomp profile for docker you usually use various filters, so I’m fairly confident that, given any workload and the syscall trace via ftrace, you can craft a docker seccomp profile that tightly fits its needed syscall profile and effectively restricts its kernel penetration to what we’ve measured.
As it happens I’m the lead author of https://rr-project.org, which uses seccomp-filter as a core part of its performance optimizations (see https://arxiv.org/abs/1705.05937).
You can’t use seccomp filters to check open() paths because seccomp-filter BPF programs can’t dereference user memory. Even if they could, or if you use SECCOMP_RET_TRACE to implement a selective ptrace jail (at much higher performance cost!), there would be a TOCTOU vulnerability because the path could be modified by other threads between seccomp filters running and the path actually being read by the open() syscall.
I think to repair your argument you’ll have to talk about what your nine syscalls are and what specific mechanisms exist — or will be built — to limit the kernel code reachable from those syscalls.
I’m not sure where “nine system calls” come from. However, the team did measure the number of system calls used by the tests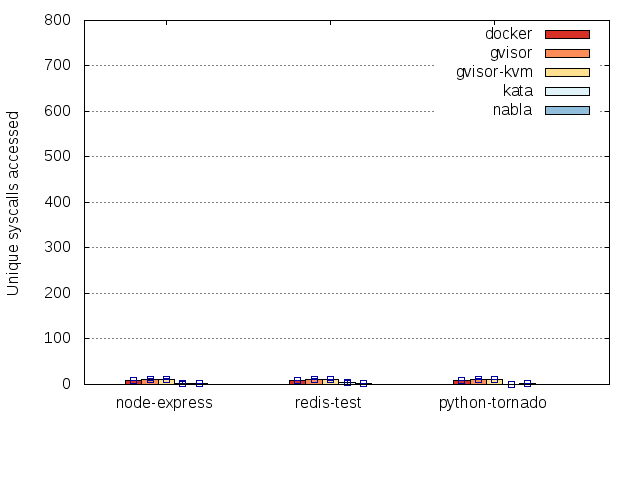 so it’s 8,10,8 for the three tests. I think it’s uncontroversial that seccomp can block the other unused system calls and the ftrace LOC methodology is fairly maximalist, so I wouldn’t expect the docker coverage to go up significantly even when we apply fuzzing to the profile, so docker being within 30% of a hypervisor using a seccomp profile on these tests is maintainable.
Hi,
Here are the allowed syscalls: read, write, exit_group, clock_gettime, ppoll, pwrite64, and pread64. They are restricted to specific file descriptors (already opened before enabling seccomp). Here is the code for more specifics: https://github.com/nabla-containers/solo5/blob/ukvm-linux-seccomp/ukvm/ukvm_hv_linux.c#L53-L106
I enjoyed reading your blog posts, and find your HAP measurements and results interesting. We performed a study that drew a lot of the same conclusions about container vs VM security.
One thing, however, I think you might want to reconsider in moving forward is the assumption that bug density is uniform in a code base. Based on studies of the Linux kernel conducted over the last year, our research group has found that the “popular paths” tend to contain fewer bugs than the less frequently used paths. Using the Gcov kernel profiling tool in our study, and being able to capture the kernel code trace data at the line-of-code level also enabled us to see the details of the code coverage inside functions. Approximating the HAP based on the amount of code traversed appears to be a useful approach to quantitative measurements, but being able to see individual line of code might further enhance its effectiveness.
What we took away from our work was that it is important to not only reduce the total amount of code accessible, but also the right type of code. If you are interested, feel free to check out our paper at (https://www.usenix.org/system/files/conference/atc17/atc17-li_yiwen.pdf). (Right now we are applying our “popular paths” metric on the LinuxKit container to reduce access to the risky “unpopular” code in the host kernel.) We are looking forward to seeing more of your work in the future!